


Temperature distribution in a power distribution box
ScrollKey facts at a glance
- Temperature distribution in the high-voltage distribution unit (HVDU) of a battery electric vehicle.
- Driving cycle with the corresponding current profile specified.
- Result: the temperatures stay far below the critical value.
- Basis for weighing conductor cross-section against material costs.
Power is distributed in a battery-electric vehicle via a power distribution box. During operation, the current conductors heat up to a certain temperature level due to today's high current levels. For a defined power, larger conductor diameters lead to lower temperatures. This is advantageous for durability, but it increases material costs.
The objectives of the investigation carried out can be summarized as follows:
1. To create a show case that demonstrates the temperature distribution using simulation in a power distribution box.
2. To provide a reference for future investigation.
3. To investigate through simulation how the HVDU behaves under transient conditions.
For this purpose, a predefined drive cycle with the corresponding current curve was imposed. The following figure shows the driving cycle used:

The results have shown that the temperature is far from the critical value. The following figure shows the temperature curve:

See the temperature distribution for all components by the end of the driving cycle:
Why calculate transiently?
In driving operation, the current fluctuates constantly. Components with a large mass heat up more slowly than thin conductors. A calculation with a constant maximum current would therefore deliver temperatures that are too high and suggest conductors that are too large, heavy and expensive. The time-dependent calculation over a driving cycle shows the temperatures actually reached.
How do you proceed?
- Modelling conductors, contacts, housing and surrounding air.
- Electrical power loss as a heat source, depending on the current.
- Specifying a driving cycle with the corresponding current profile.
- Evaluating the temperature over time for all components and comparing it with permissible limits.
Frequently asked questions
What can be optimised with this?
Conductor cross-sections, material use and arrangement, without exceeding the permissible temperatures.
Which data are needed?
Geometry, material data, contact resistances and the relevant current profile.
Further reading: Cooling of a charging cable for HPC/MWC · Thermal management of a battery
Share Project:
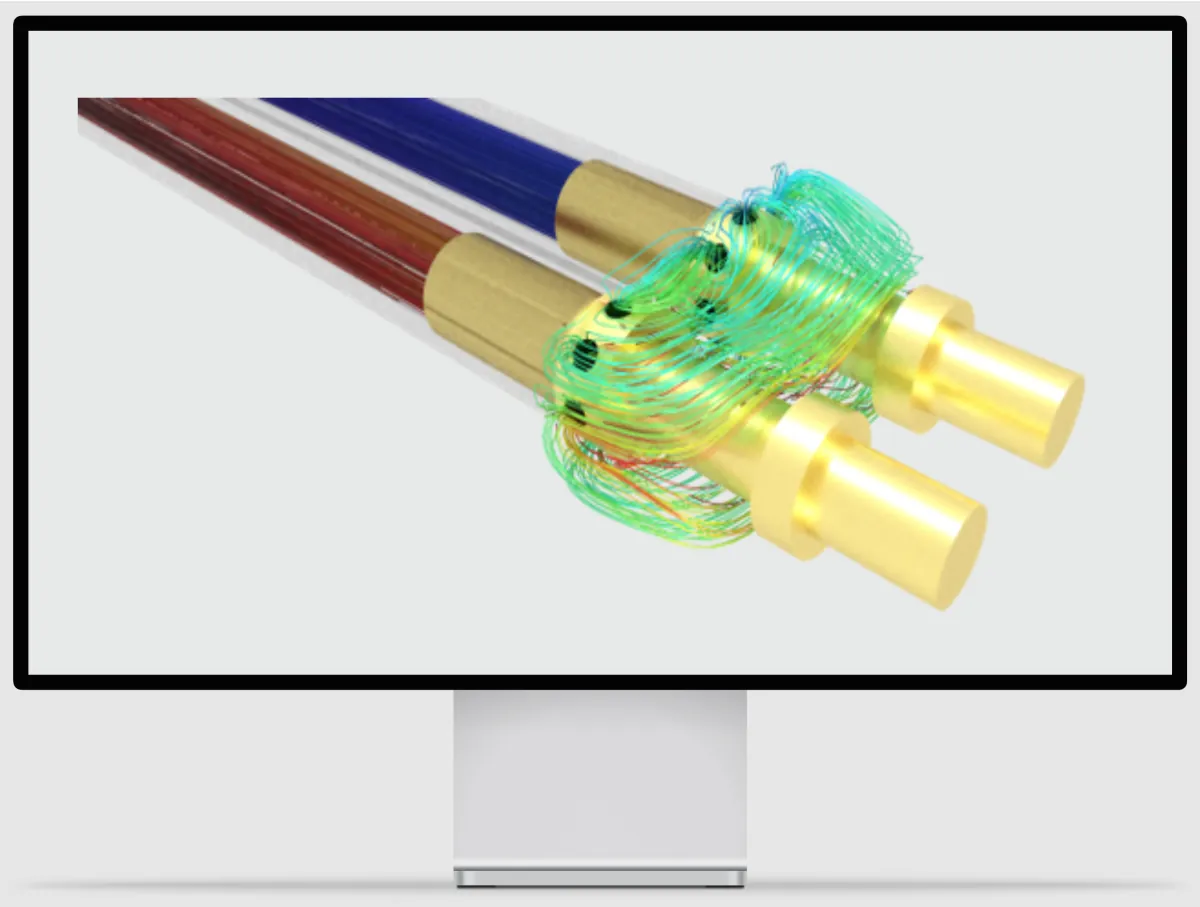
High performance cooling of a charging cable for HPC/MWC application
View Project
CFD-Simulation für HPC/MWC-Ladekabel: Steckertemperatur um bis zu 35 °C senken
Optimierte Flüssigkeitskühlung senkt die Steckertemperatur um bis zu 35 °C und verlängert die Lebensdauer.
Projekt ansehen